WiFi Trilateration With Three or More Points
The popularity of WiFi networks has been rising rapidly during the last 15 years. In urban areas hotspots are ubiquous. These hotspots together with trilateration algorithms provide a cheap way to find out yours or someone elses location.
Because of my previous work with Apple location services I wanted to figure out how trilateration works. Being a school dropout I am really really bad in mathematics. However I consider myself good at trial and error so I reckon this should be doable.
Where Three Circles Overlap
Basic idea is that if you know the distance to three other locations it is possible to figure out your current location. This is the geometrical way to solve the problem. To test it out I googled the coordinates three cities and calculated their distance from Tallinn.
To calculate the distances I used R. If you are on macOS you can install it with homebrew.
$ brew install homebrew/science/r
Do not be intimidated by the looks of R. It is made by the academic scholars whose first concern is not usability. R can do everything you ever need to do with math and then some more. It is quite convenient for smaller things too.
Below are the haversine distance calculations.
$ R
> library(geosphere)
> distHaversine(c(24.7535, 59.437), c(24.9354, 60.1695)) # Helsinki
> distHaversine(c(24.7535, 59.437), c(26.7251, 58.3806)) # Tartu
> distHaversine(c(24.7535, 59.437), c(24.4971, 58.3859)) # Pärnu
[1] 82175.02
[1] 163311.4
[1] 117932.2
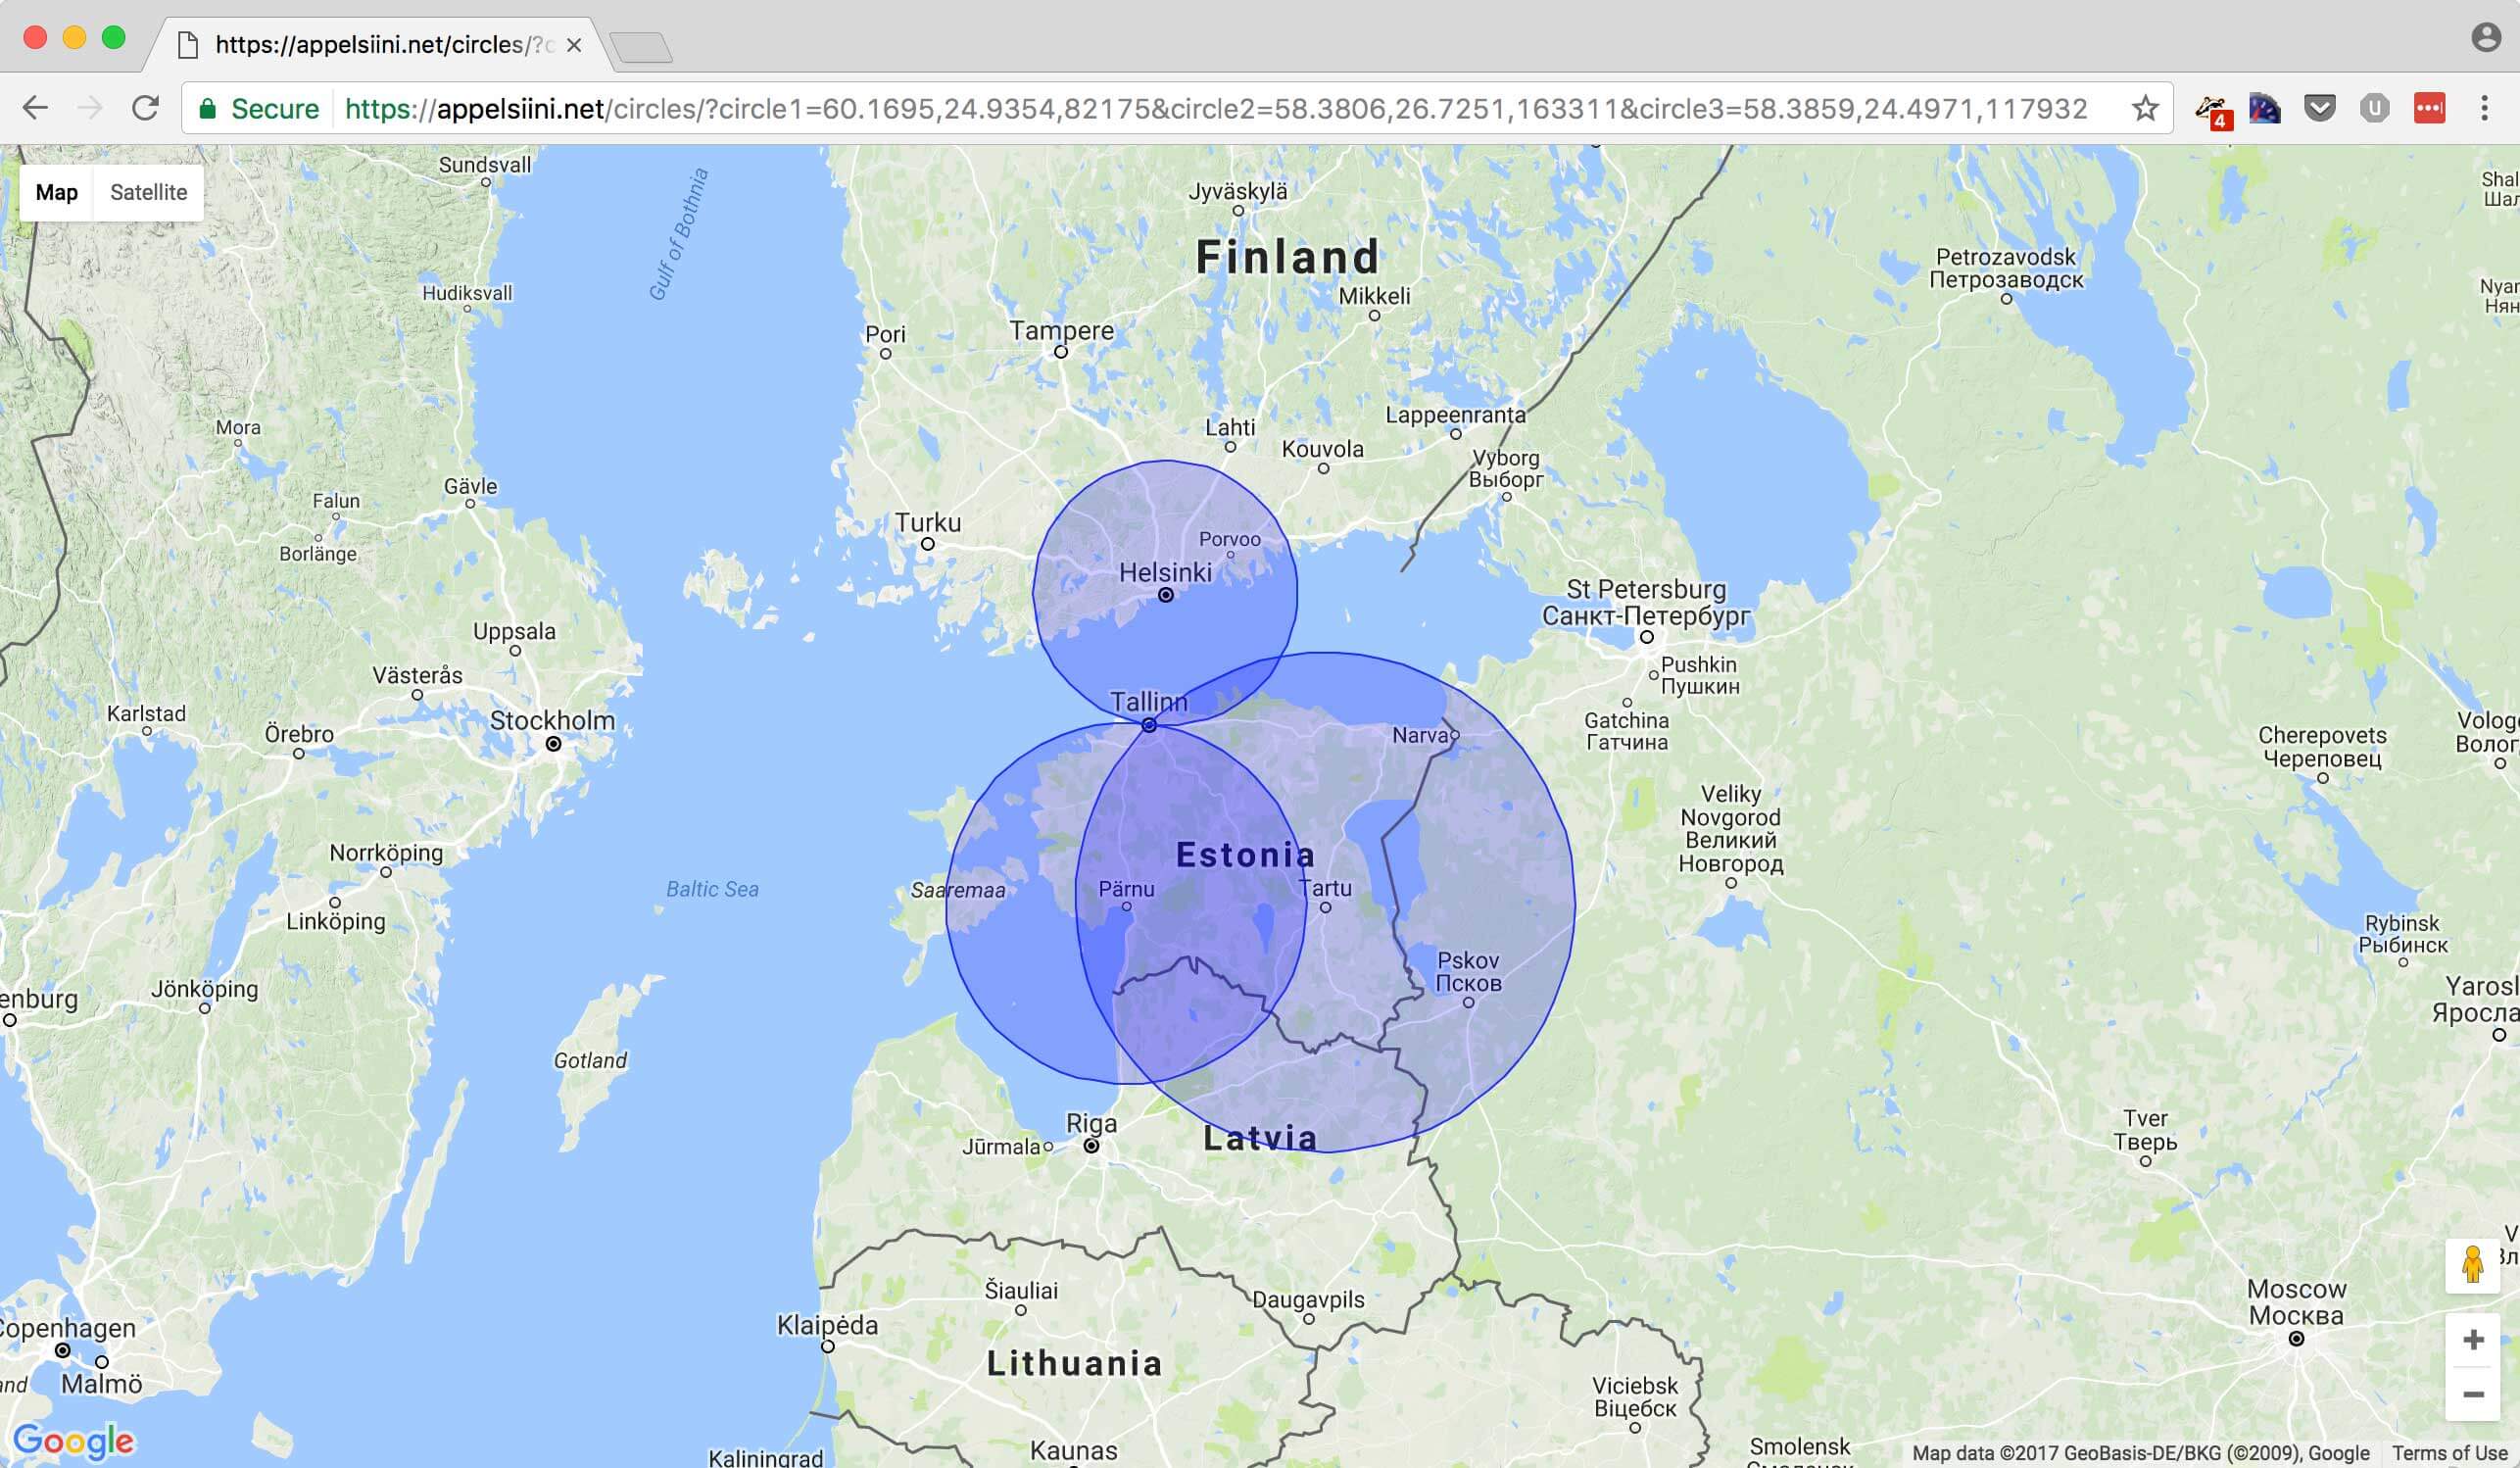
To test this out I also made a Google Maps page for visualizing the logic. On the map I drew three circles with the distance from Tallinn as radius from each city center.
They seem to intersect over Tallinn as expected.
Distance From RSSI
Lets go back for a while. We were talking about WiFi routers. You do know the coordinates of couple hotspots in the vicinity. What is the distance to them?
Distance to a WiFi hotspot can calculated using the received signal strength indicator (RSSI). If the hotspot is located open air this is fairly accurate. If there are obstacles in the way accuracy is detoriated fast. As you already might have guessed, in urban areas the accuracy is notoriously bad.
But hey, it’s something.
RSSI is expressed as a negative number. The more negative the number, the weaker the signal. The closer to zero the number is the stronger the signal is. Anything down to -75 is considered a good signal.
Below is a one algorithm to calculate distance from RSSI. In the algorithm d is the distance in metres,n is the path-loss exponent and Ptx is the transmitter power in dBm.
Choosing value for n is not exact science and it depends on the enviroment. Typical values are: 2 for free space, 2.7 to 3.5 for urban areas, 3.0 to 5.0 in suburban areas and 1.6 to 1.8 for indoors when there is line of sight to the router.
Default transmit power Ptx for DD-WRT based routers is 70mW or 18.5dBm. I use this value for calculations. Transmit power varies a lot between manufacturers.
RSSI = Ptx - 10 * n * log10(d)
d = 10 ^ ((Ptx - RSSI) / (10 * n))
Putting this to R gives us believeable results.
$ R
10 ^ ((18.5 - -70) / (10 * 3.5))
10 ^ ((18.5 - -70) / (10 * 5.0))
[1] 337.7314
[1] 58.88437
Trilateration With Three Points
Circles on the map proved the intersection is what I am looking for. I had no idea how to calculate this though. All searches led to the Trilateration entry in Wikipedia. It has good step by step instructions.
I do not claim I fully understand how it works, but following the instructions I was able to port the trilateration algorithm to R. I had some problems first but then I figured out coordinates should be converted to ECEH system.
library("pracma")

# Earth radius in metres
EARTH_RADIUS <- 6378137

# Helper function for converting to ECEH coordinates
eceh <- function (s) {
    vx <- EARTH_RADIUS * (cos(deg2rad(s[1])) * cos(deg2rad(s[2])))
    vy <- EARTH_RADIUS * (cos(deg2rad(s[1])) * sin(deg2rad(s[2])))
    vz <- EARTH_RADIUS * (sin(deg2rad(s[1])))
    c(vx, vy, vz)
}

# Helper function for normalizing a vector
normalize <- function (x) { x / sqrt(sum(x^2)) }

# Three spheres
s1 <- c(59.43250050, 24.76253500, 36)
s2 <- c(59.43170784, 24.76271075, 54)
s3 <- c(59.43226950, 24.76160953, 62)
P1 <- eceh(s1)
P2 <- eceh(s2)
P3 <- eceh(s3)

ex <- normalize(P2 - P1);
i <- dot(ex, P3 -P1)
ey <- normalize(P3 - P1 - ex * i);
ez <- cross(ex, ey)
d = dist(rbind(P2, P1))
j = dot(ey, P3 - P1)

x = (s1[3] ^ 2 - s2[3] ^ 2 + d ^ 2) / (2 * d);
y = ((s1[3] ^ 2 - s3[3] ^ 2 + i ^ 2 + j ^ 2) / (2 * j)) - ((i / j) * x);
z = sqrt(s1[3] ^ 2 - x ^ 2 - y ^ 2)

triPt = P1 + ex * x + ey * y + ez * z;

latitude = rad2deg(asin(triPt[3] / EARTH_RADIUS));
longitude = rad2deg(atan2(triPt[2], triPt[1]));

paste(latitude, longitude, sep=",")

[1] "59.4321096315479,24.7626895411386"
See the RFiddle for properly commented version. The code works quite well with perfect or near perfect input. I am not sure what causes the slight error. I guess the ECEH conversion is not accurate since it assumes earth is perfectly round.
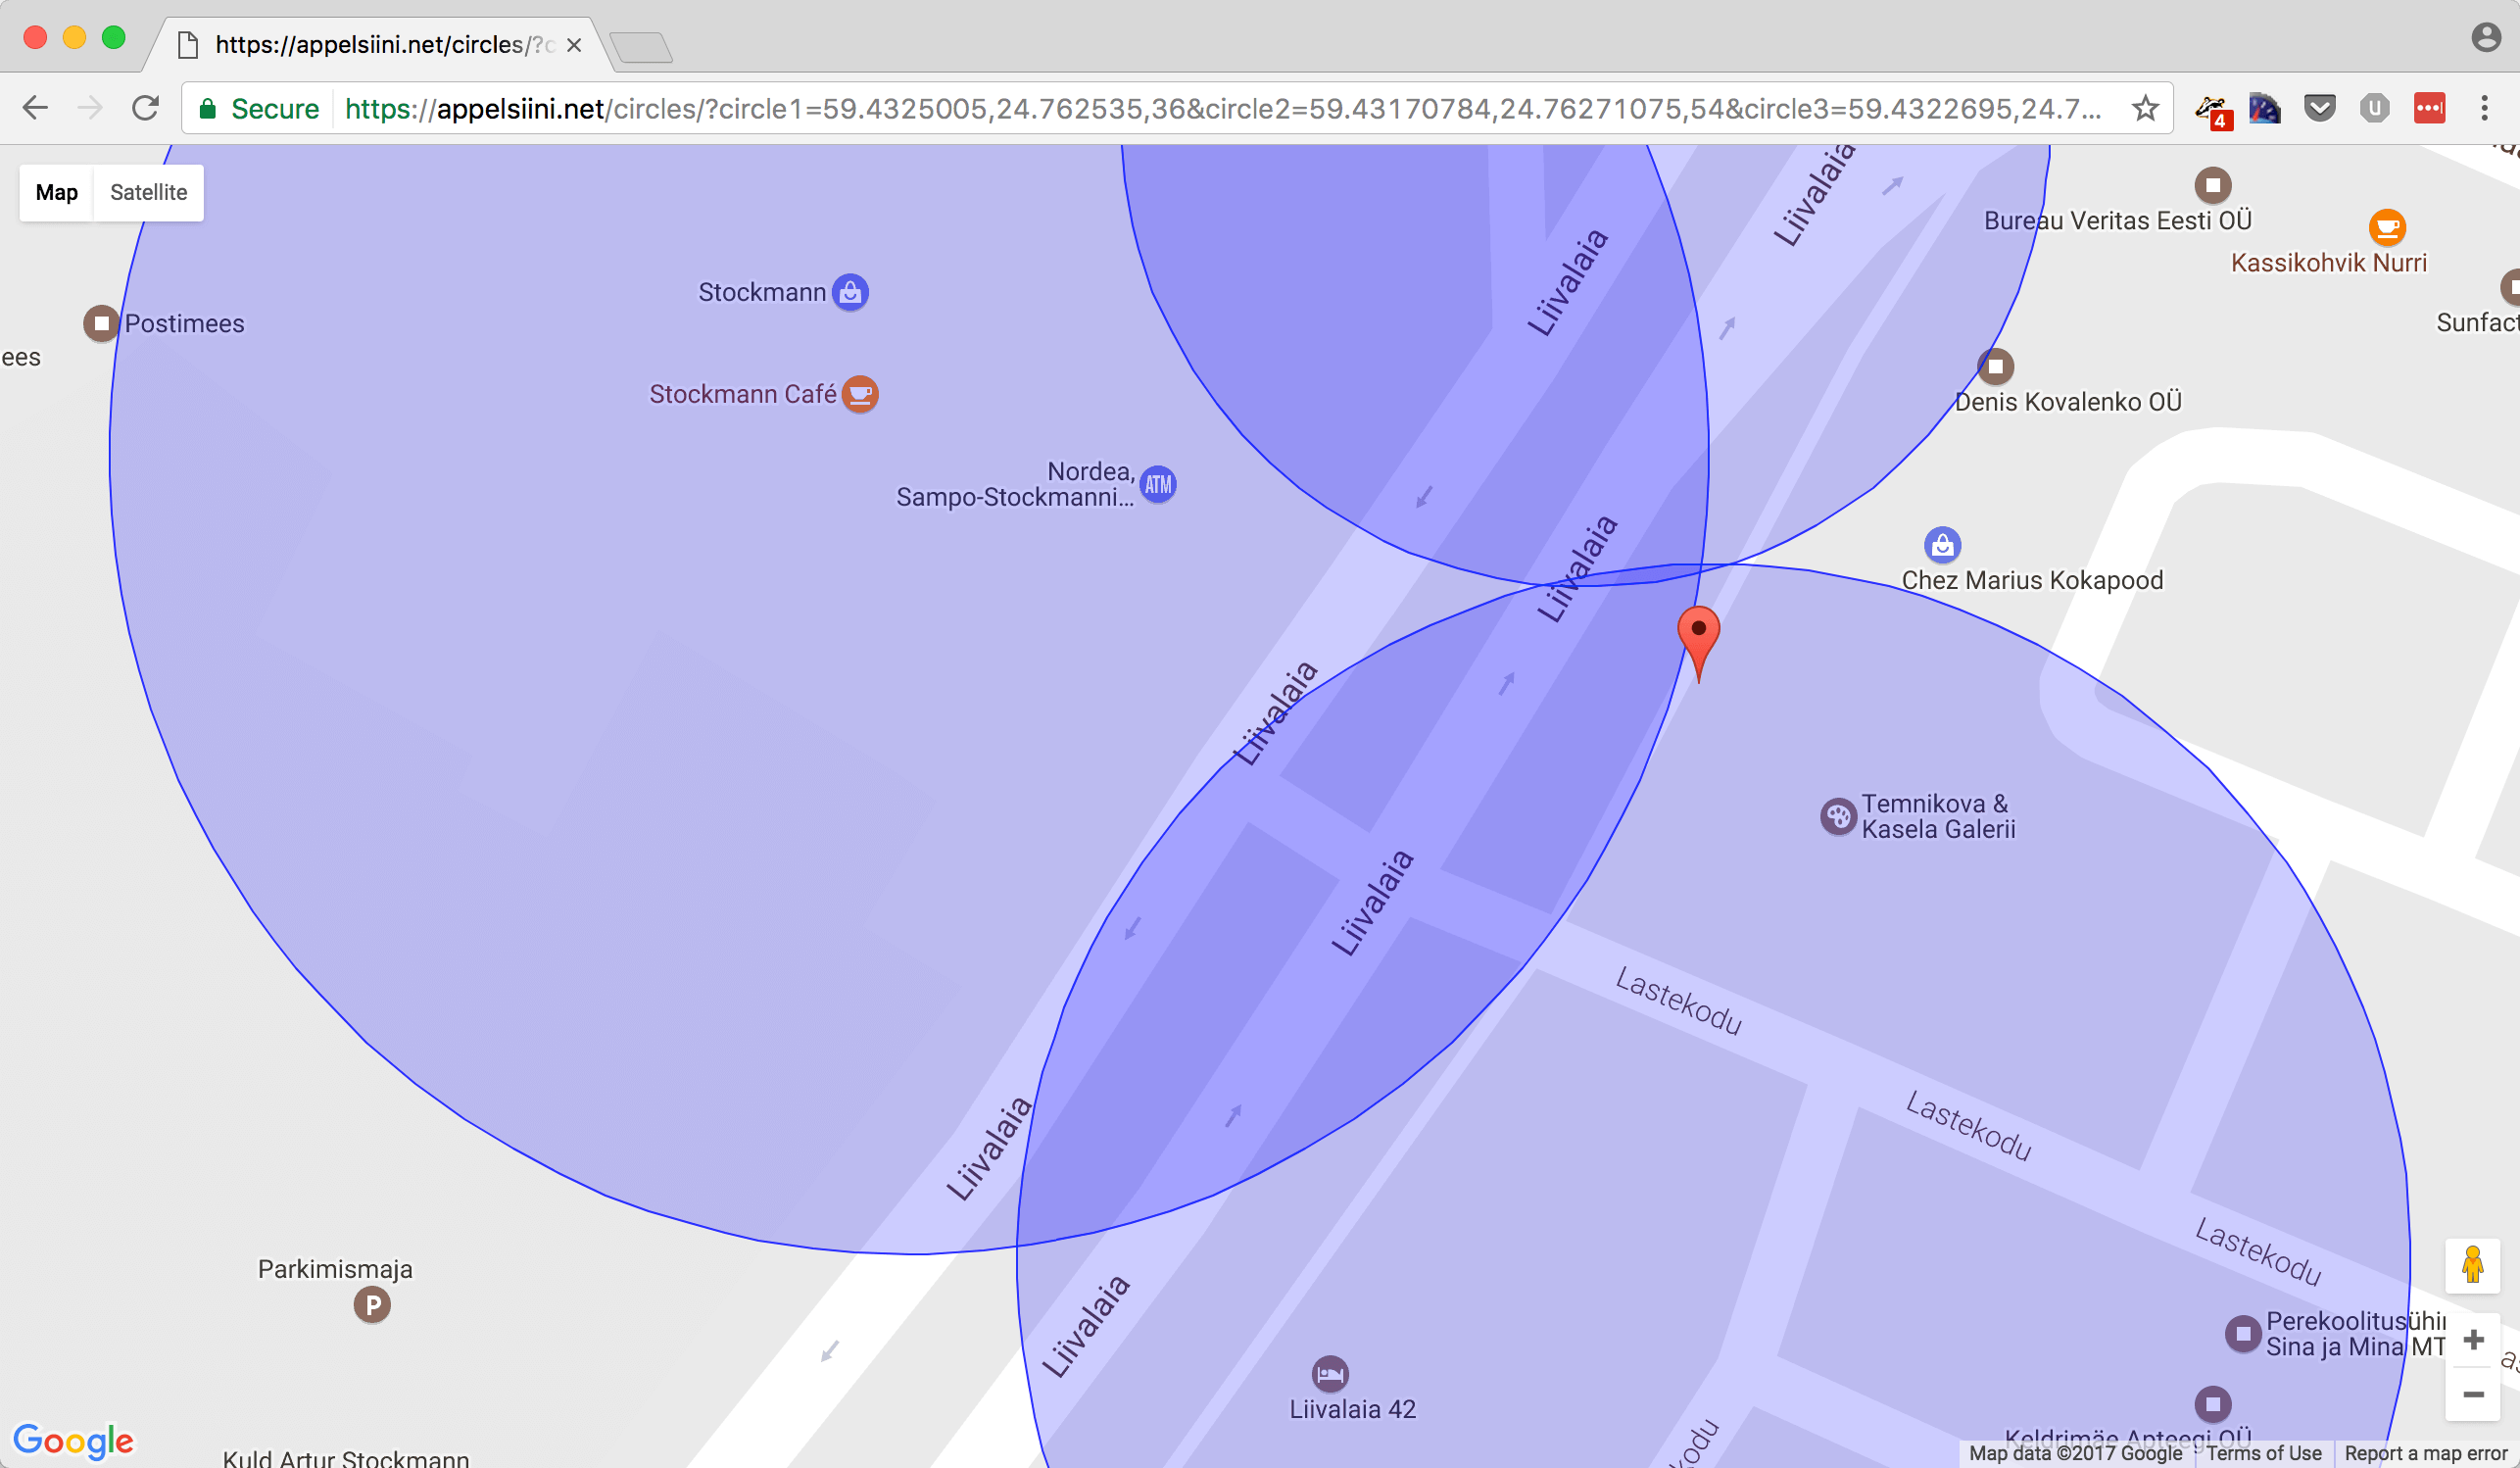
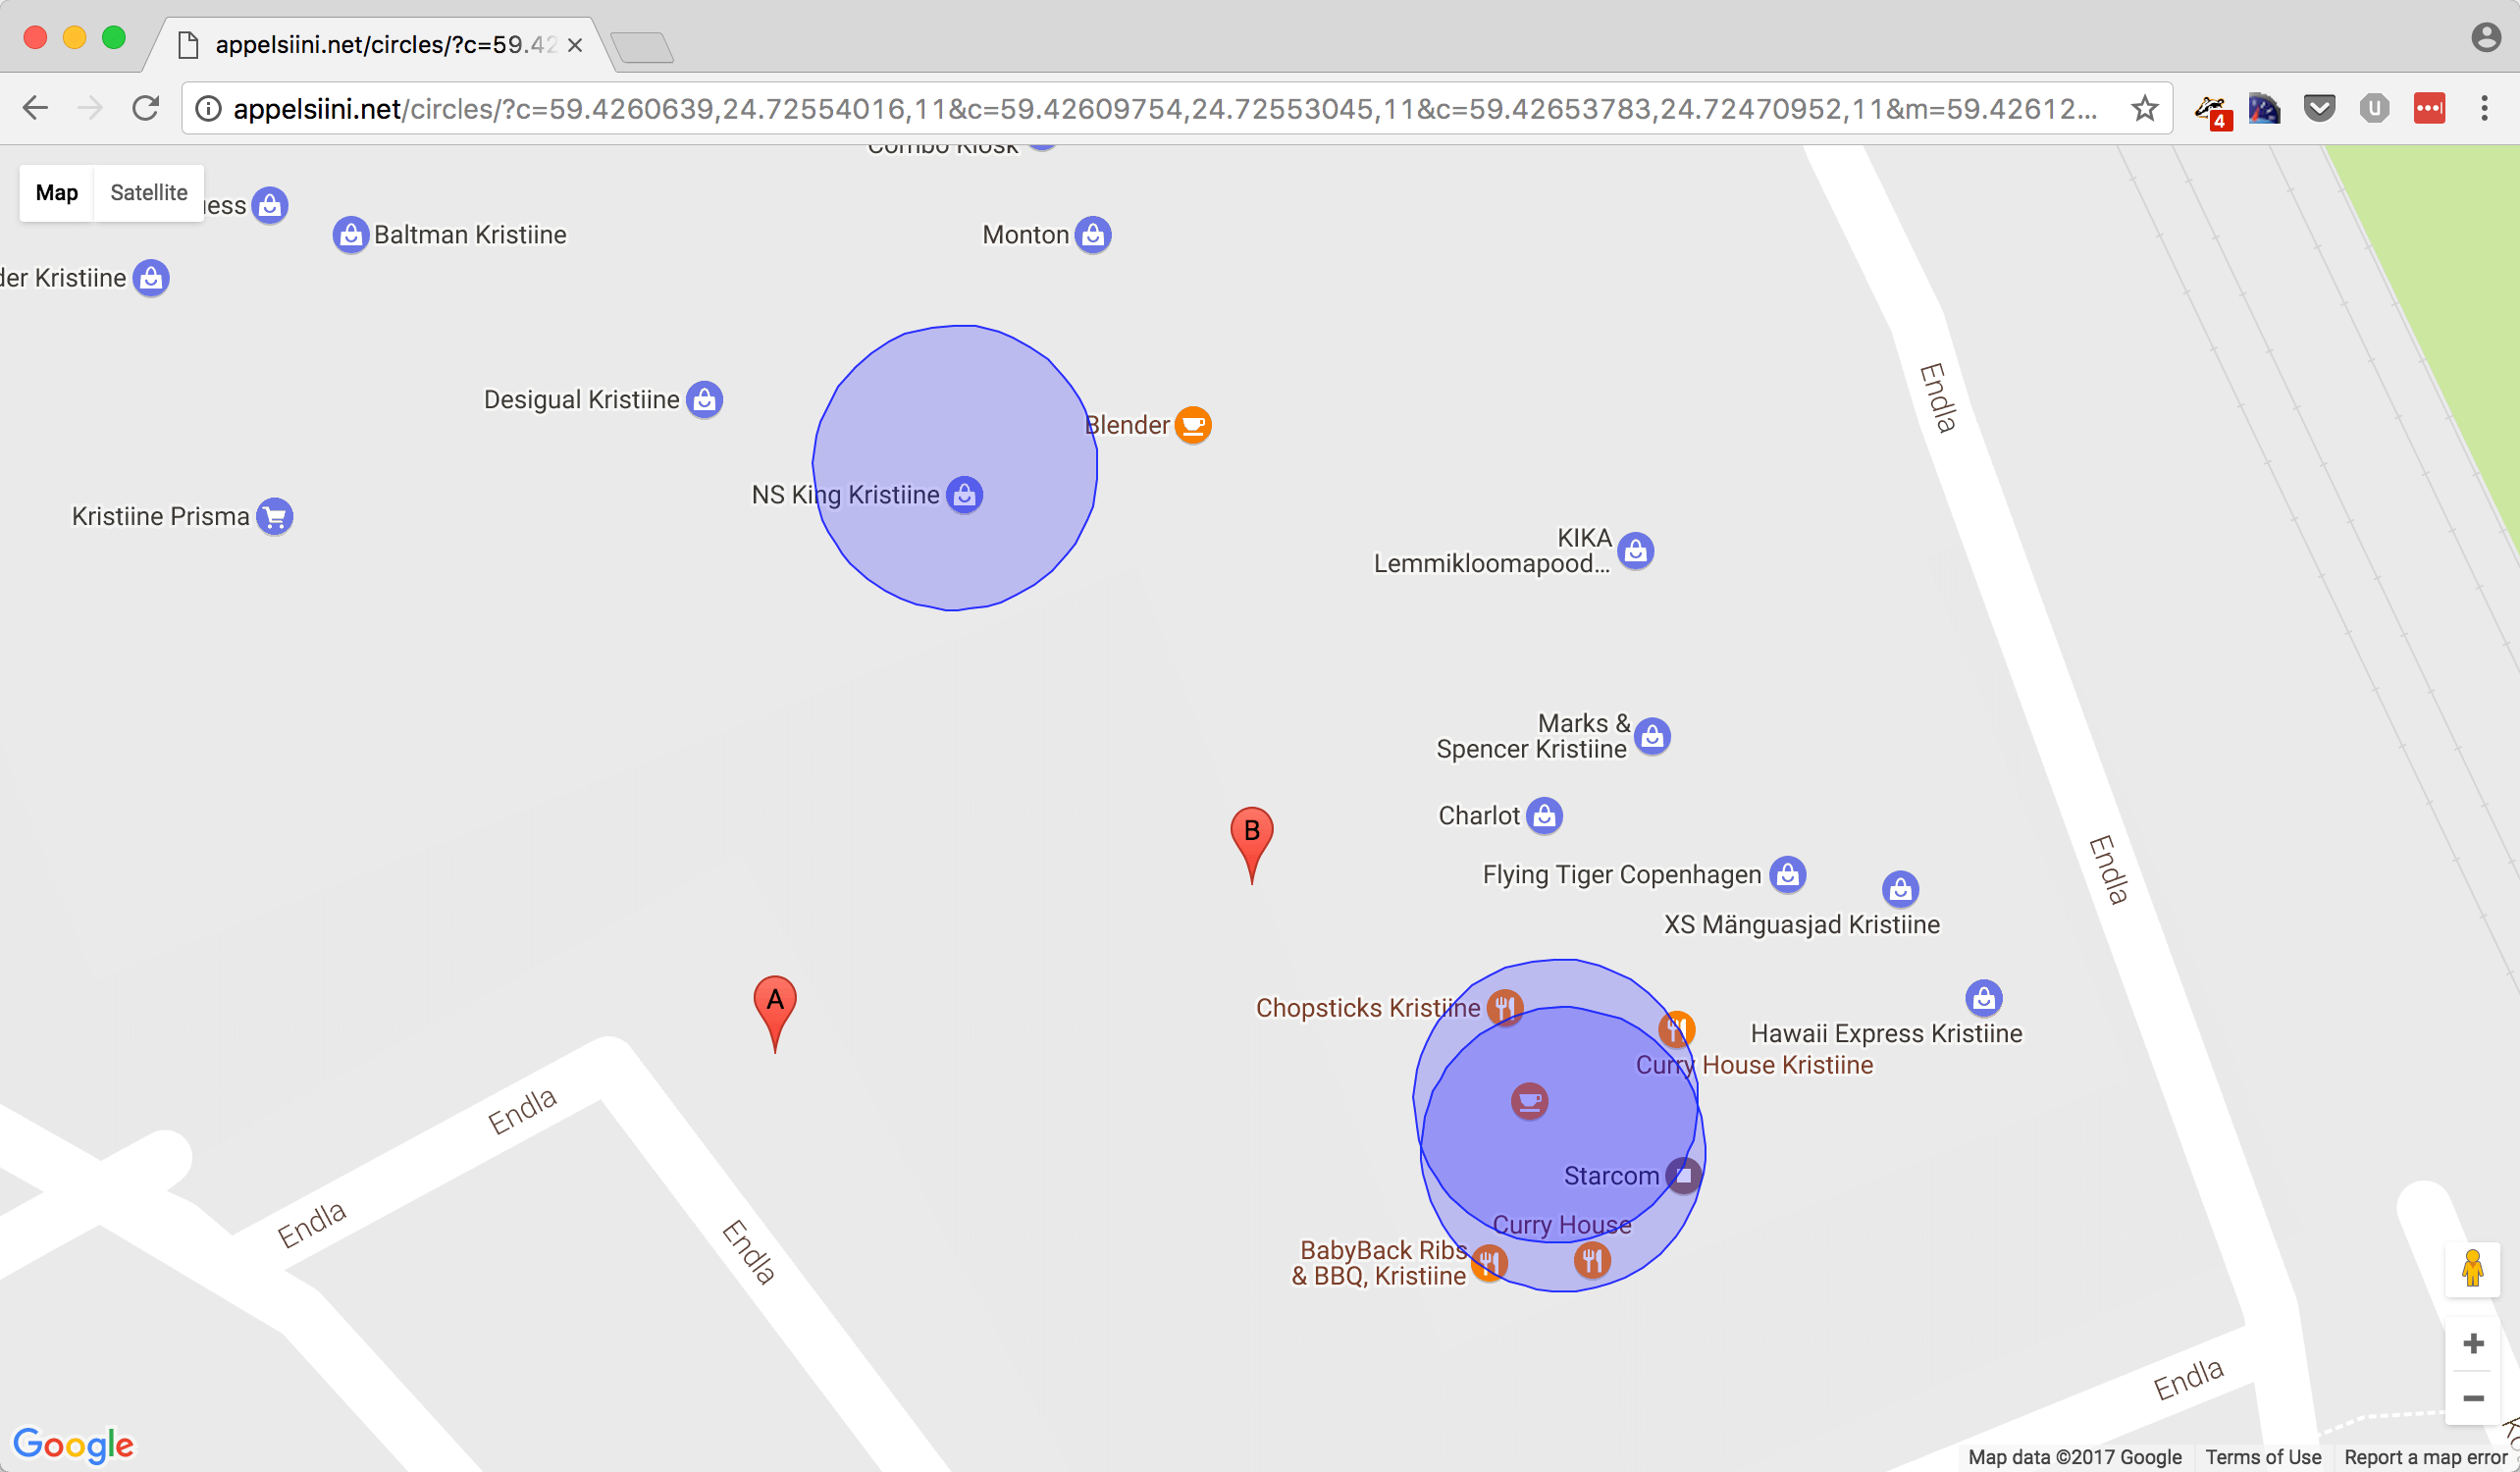
When we introduce errors to input data the algorithm gets confused.
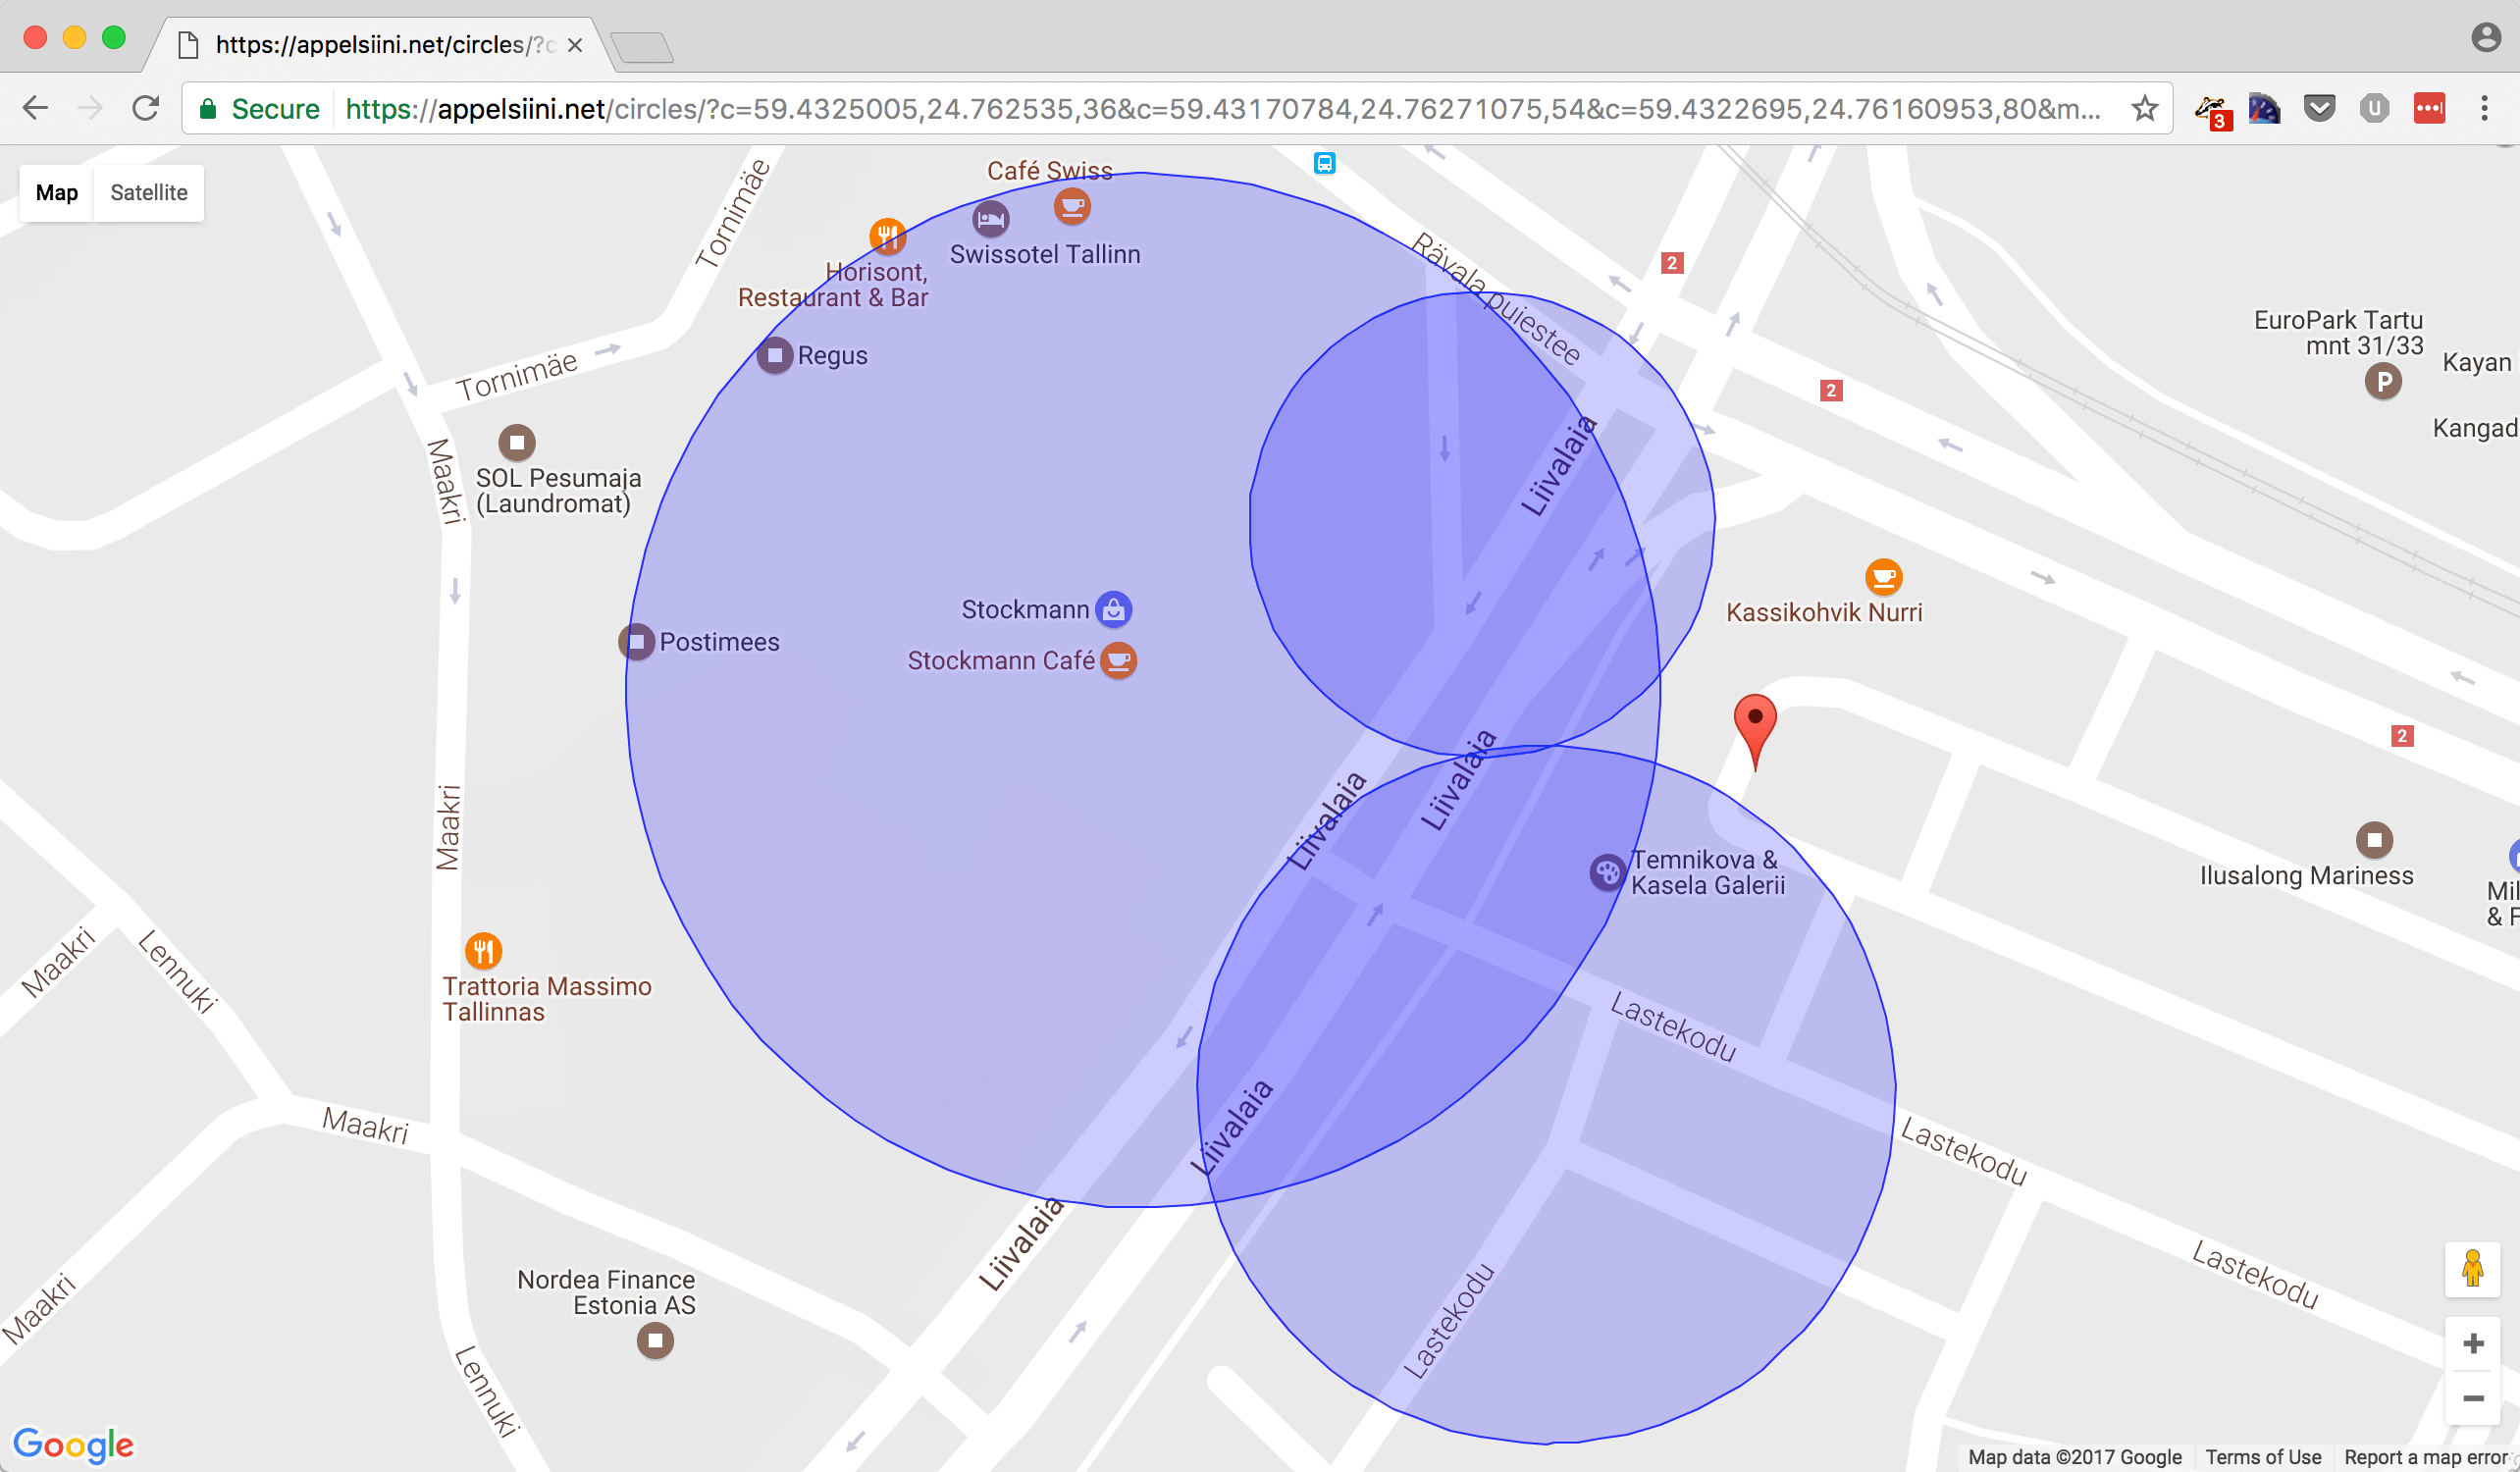
Even worse if the circles do not overlap the algorithm does not return result at all. Workaround is quite simple though. Gradually increase the radius of the circles until they overlap and then do the calculation.
This is not a mathematically correct solution. It gives reasonably good results though.
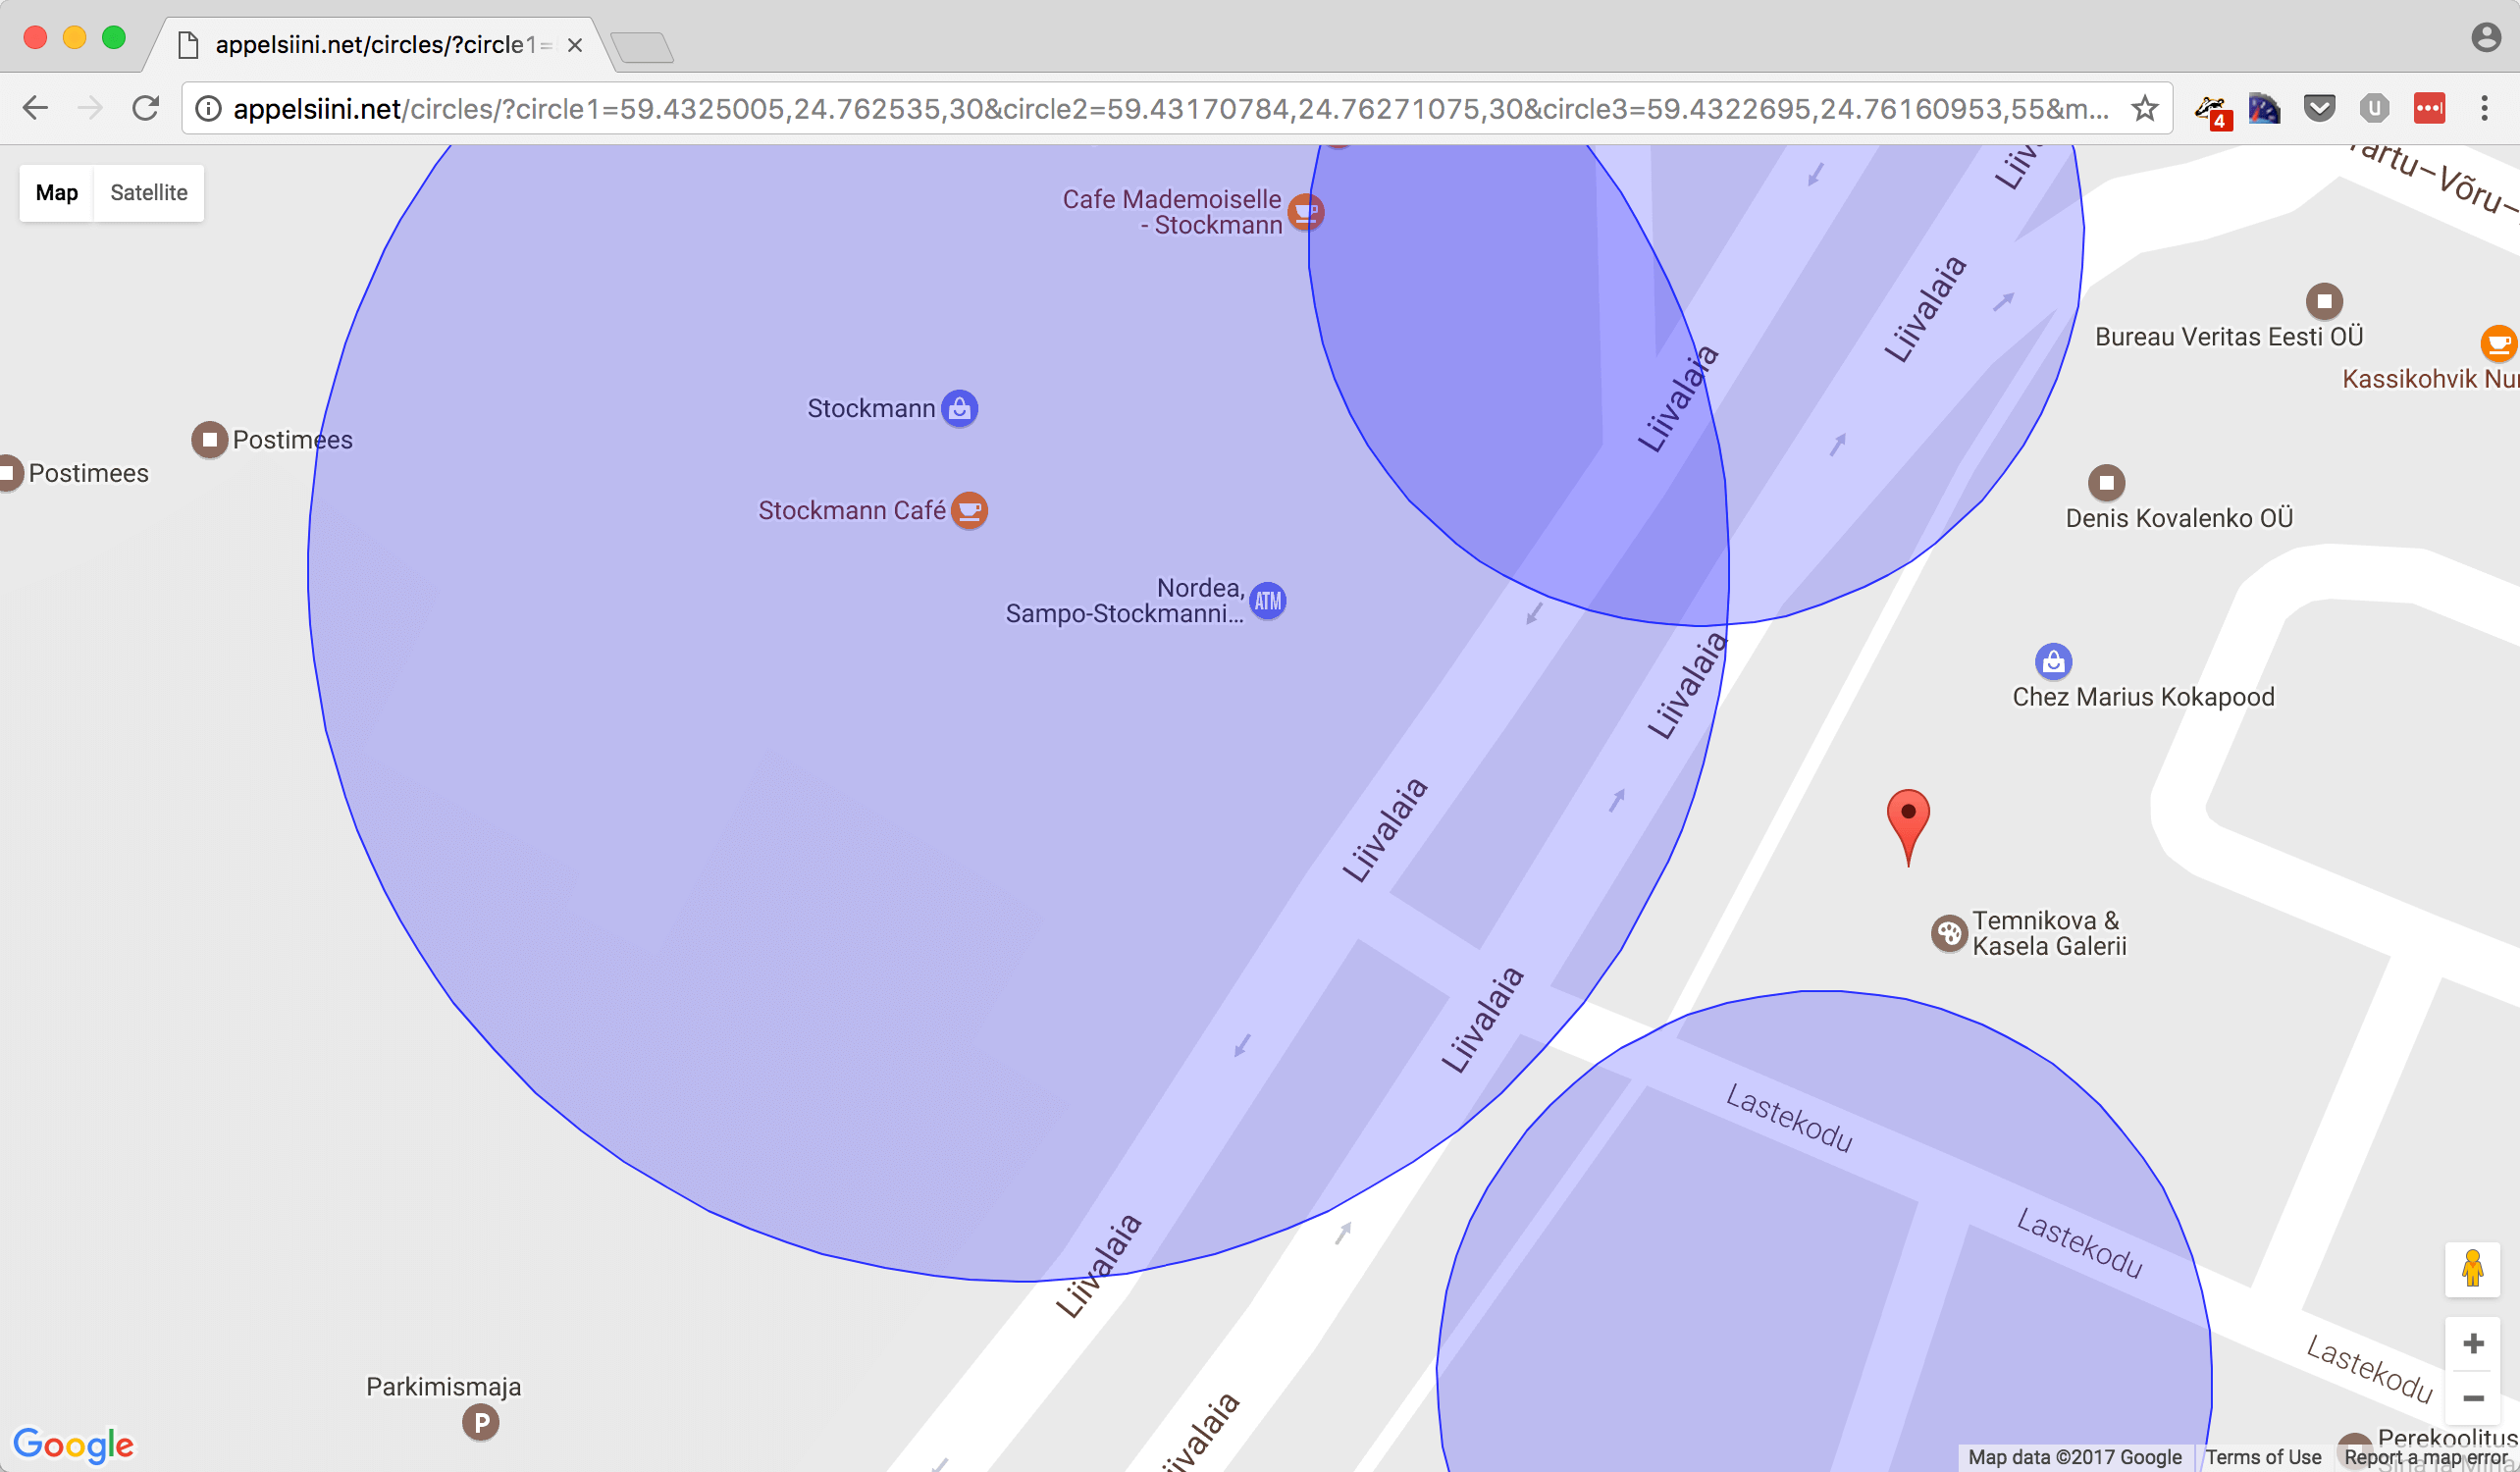
With real life data the results are not that good. A is the trilateration result while B is the real location where the scan was made.
Nonlinear Least Squares
Trilateration using a geometrical model is good when you have near perfect input. Like we learned earlier deriving distance from RSSI is just an educated guess. The geometrical model works with two or three points. What if we have four or five points?
There is a better way called Nonlinear Least Squares Fitting. This is a hard concept to grasp at first. It can be used to solve an optimization problem. In our case the problem is finding the point which represents in the best possible way the three or more points of the WiFi routers.
Nonlinear Least Squares Fitting solves this by trying different coordinates, and then summing the squared error ie. distances from this point to location of each WiFi router. Goal is to find a point where the sum of the squared distances is as small as possible.
Think of Nonlinear Least Squares fitting as mathematical brute forcing.
Trilateration With n Points
Luckily for us R has a Nonlinear Least Squares function. It needs locations parameter which should contain both coordinates and distances. We use distm function from geosphere package for the fitting. Distm calculates the haversine distance between two coordinates.
We also need to provide a starting point. This enables the algorithm to find the results faster. Remember, this is kind of brute forcing. If we aproximately already know what we are looking for brute forcing will be faster.
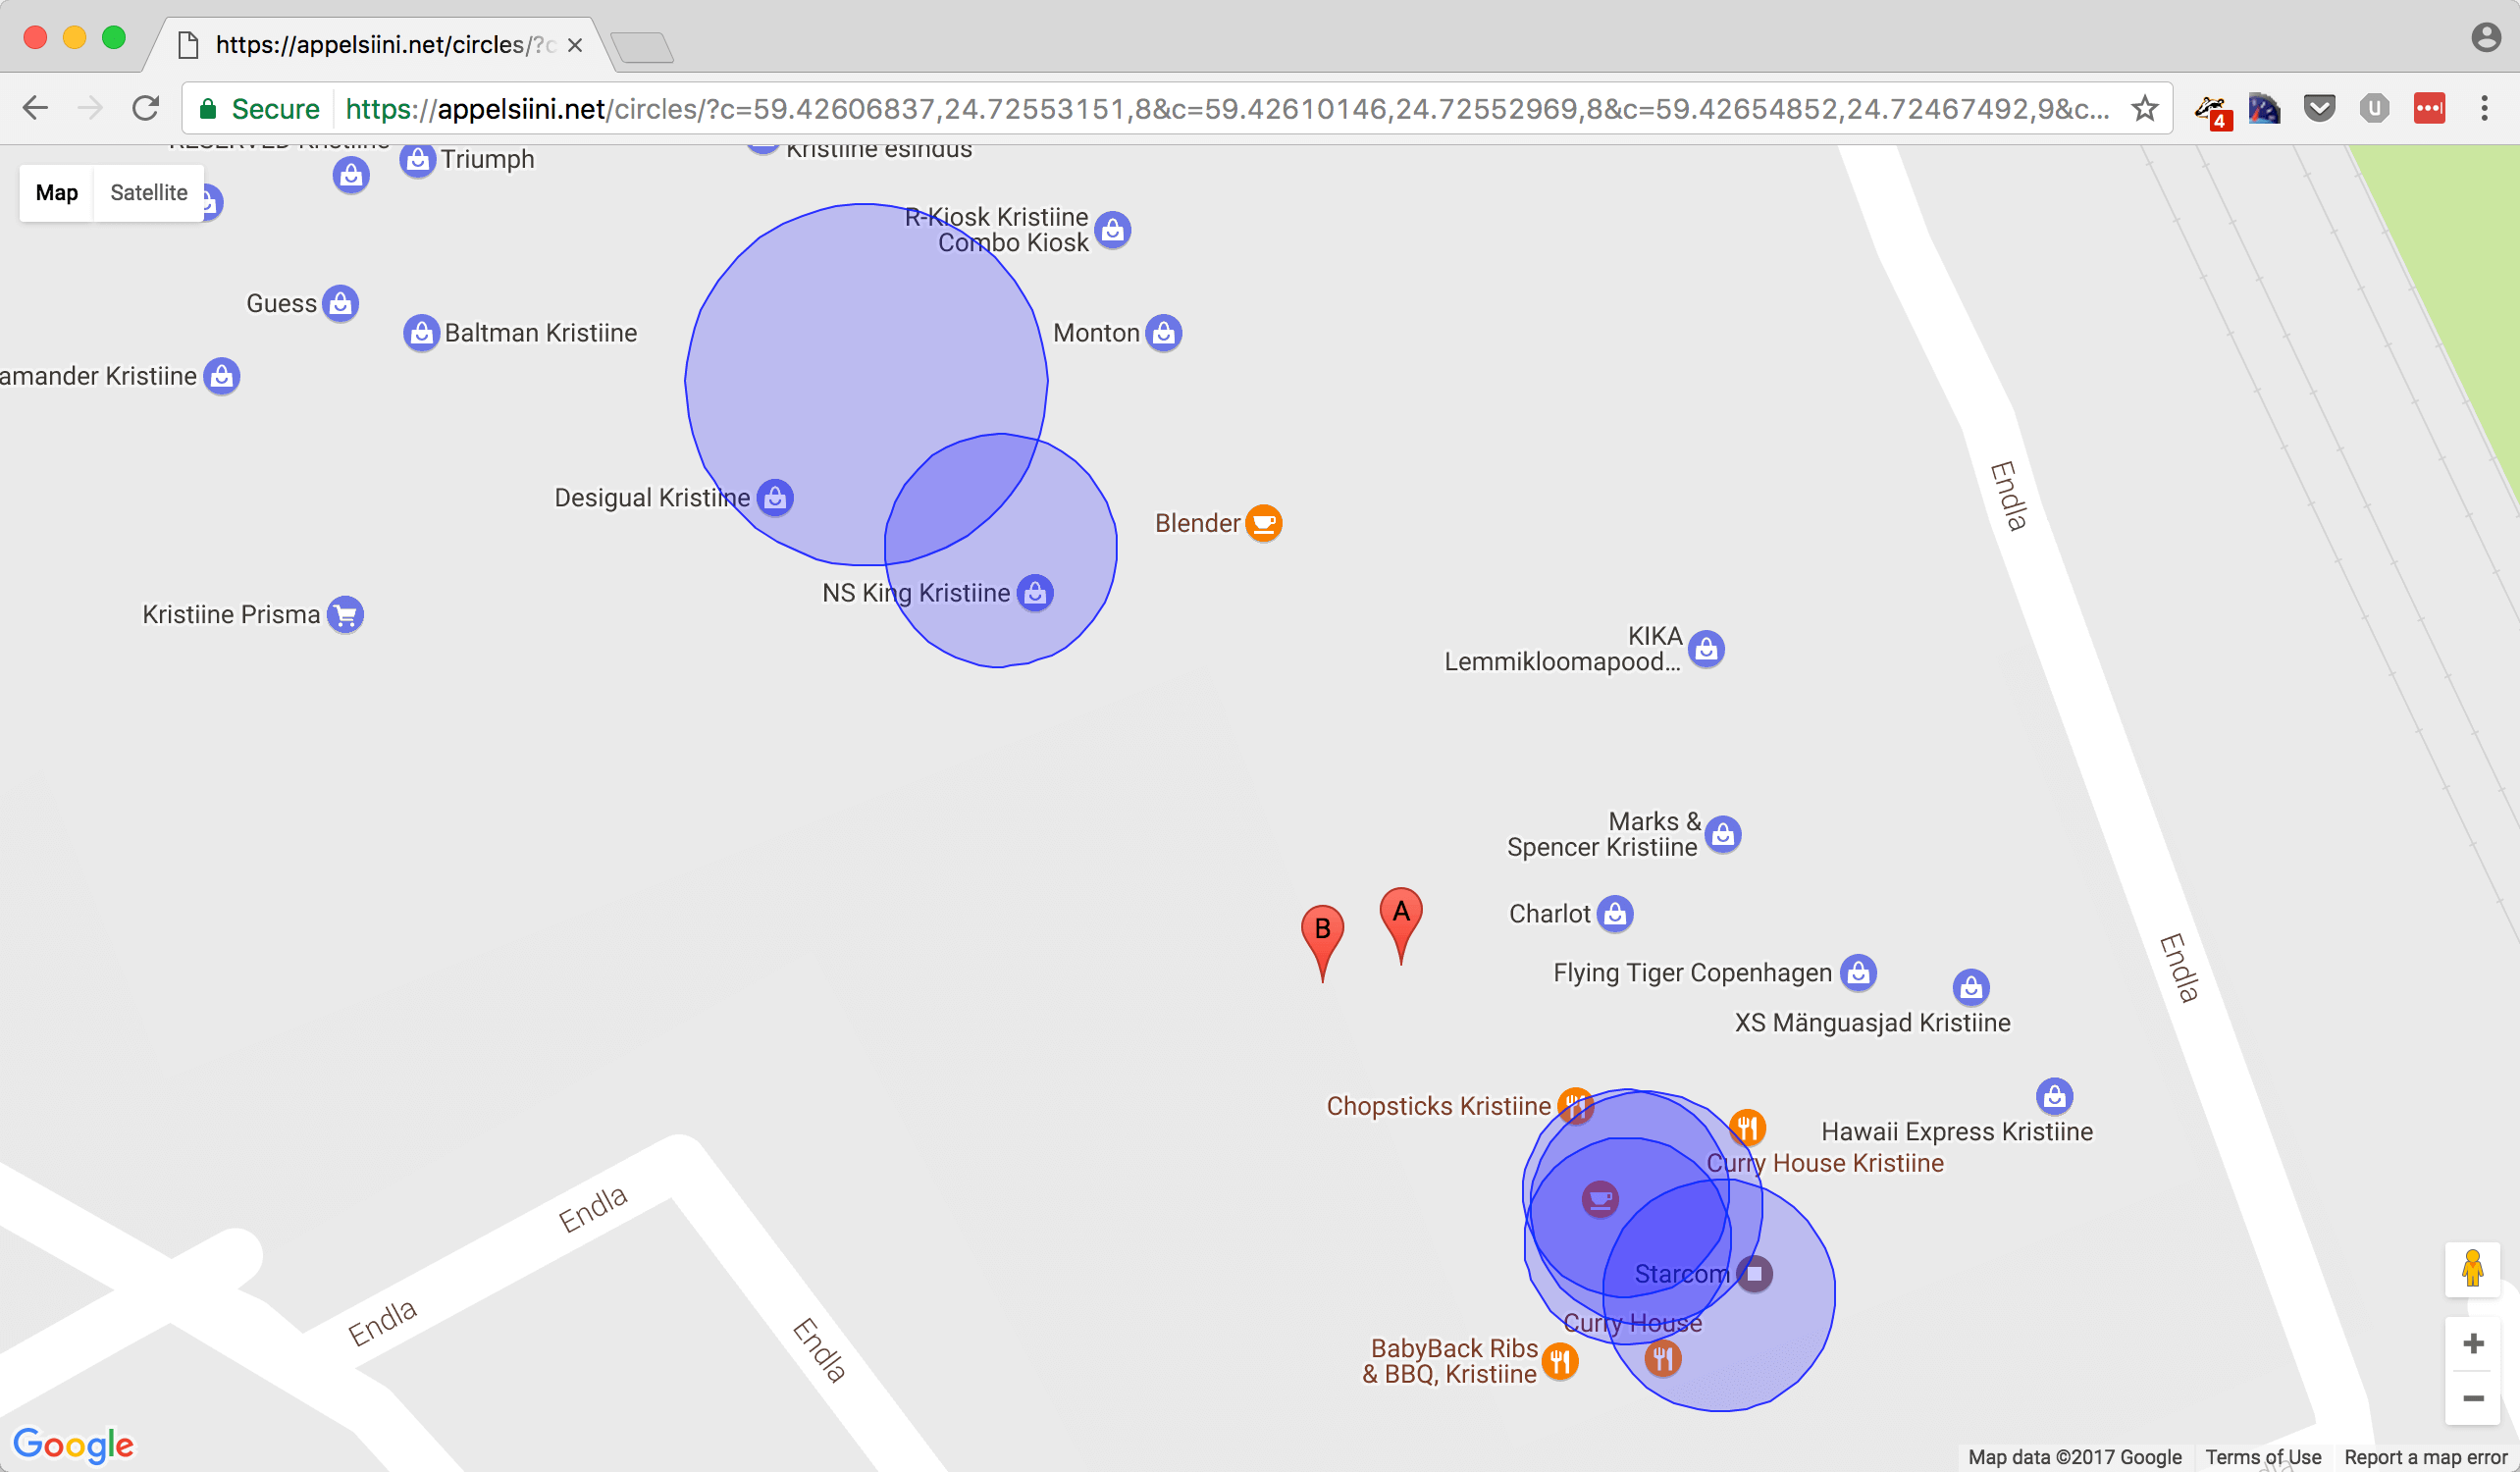
Good starting point is to use averages of all given coordinates. Here we take the same real life data as above but include more hotspots.
library(geosphere)

locations <- data.frame(
    latitude = c(
        59.42606837, 59.42610146, 59.42654852, 59.42609108,
        59.42603039, 59.42666361
    ),
    longitude = c(
        24.72553151, 24.72552969, 24.72467492, 24.72555759,
        24.72565661, 24.72449149
    ),
    distance = c(8, 8, 9, 9, 9, 14)
)

# Use average as the starting point
fit <- nls(
    distance ~ distm(
        data.frame(longitude, latitude),
        c(fitLongitude, fitLatitude)
    ),
    data = locations,
    start = list(
        fitLongitude=mean(locations$longitude),
        fitLatitude=mean(locations$latitude)
    ),
    control = list(maxiter = 1000, tol = 1e-02)
)

# Result
latitude <- summary(fit)$coefficients[2]
longitude <- summary(fit)$coefficients[1]

paste(latitude, longitude, sep=",")

[1] "59.4262604020993,24.7252212766657"
Results are really good. There is only few meters difference between the calculated point A and the real location B.
Additional Reading
Circles and spheres by Paul Bourke has quite down to earth no-nonsense notes and algorithms about dealing with circles and spheres.
Reverse-Engineering Exact Location Information Through Trilateration by Henrik Mühe has a good explanation about trilateration as an optimization problem.
Positioning and Trilateration by Alan Zucconi has more thorough explanation about everything I wrote above. Python implementation of fitting algorithm is also included.
Implementations
Trilateration for PHP implements both geometric intersection and nonlinear least squares methods. Latter needs an R command line intepreter to be installed.
Trilateration.js is a JavaScript port of the Wikipedia example. Another library called trilat has a nonlinear least squares version. For go there is Trilateration which also is a port of Wikipedia example.